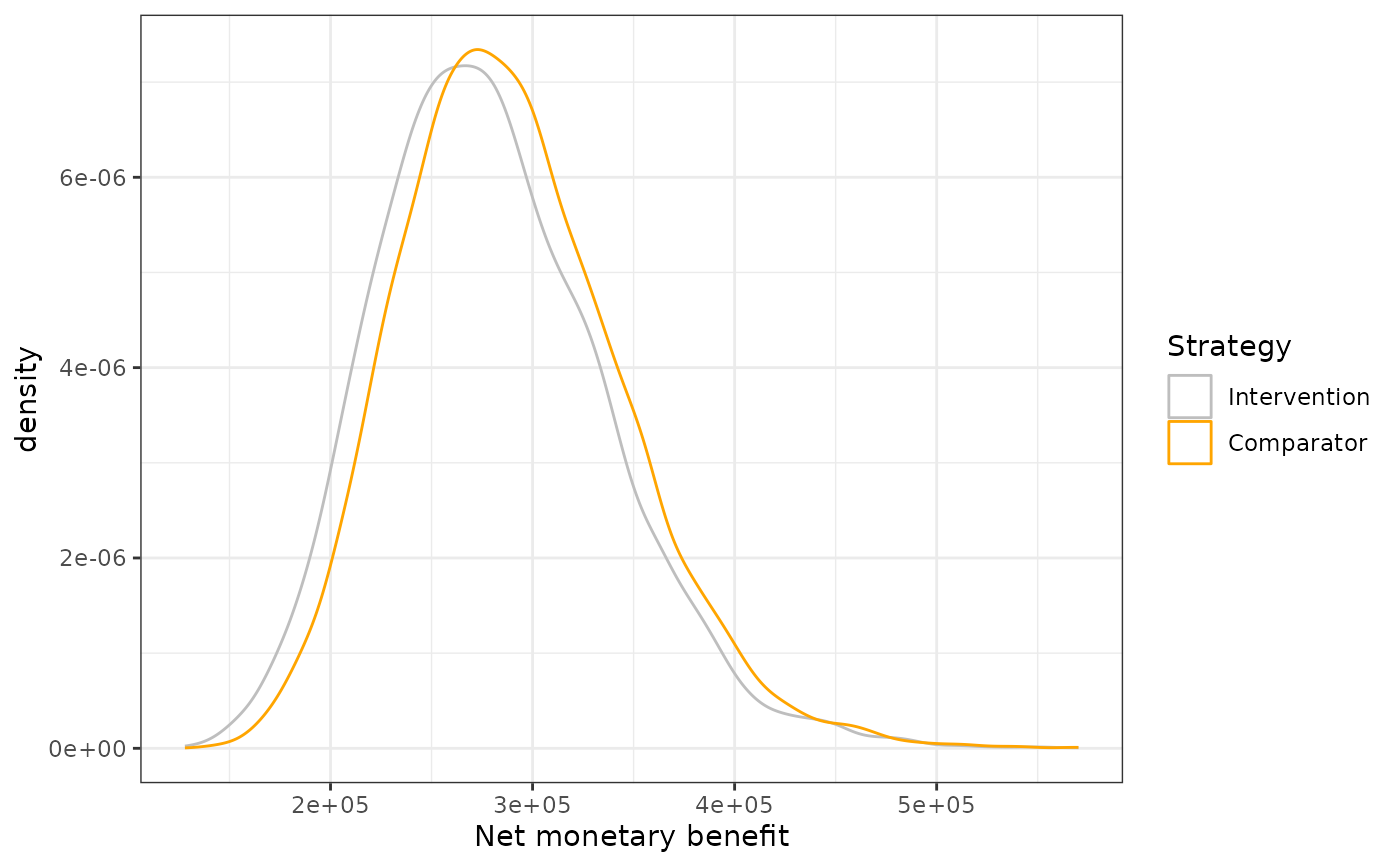
This function plots the Net Monetary Benefits (NMB) and Net Health Benefits (NHB) for each strategy and the incremental NMB and NHB (only pairwise comparison).
Arguments
- df
a dataframe obtained through `calculate_nb()`
- NMB
logical. Should the (i)NMBs be plotted? Default is TRUE, if FALSE, (i)NHBs are plotted.
- comparators
logical. Should the NMB/NHB for each comparator be plotted? Default is TRUE.
- incremental
logical. Should the incremental NMB/NHB be plotted? Default is FALSE
Details
The use this function, the dataframe `df` should contain the variables `NMB_int`, `NMB_comp`, `iNMB`, `NHB_int`, `NHB_comp`, and `iNHB`. For instance, use the calculate_nb function to calculate these outcomes.
Examples
# Calculate NB's at a willingness-to-pay threshold of 80000 per unit of effects
data("df_pa")
df_nmb <- calculate_nb(df = df_pa,
             e_int = "t_qaly_d_int",
             e_comp = "t_qaly_d_comp",
             c_int = "t_costs_d_int",
             c_comp = "t_costs_d_comp",
             wtp = 80000)

# Plot NMB's for each comparator
plot_nb(df = df_nmb,
        NMB = TRUE,
        comparators = TRUE)