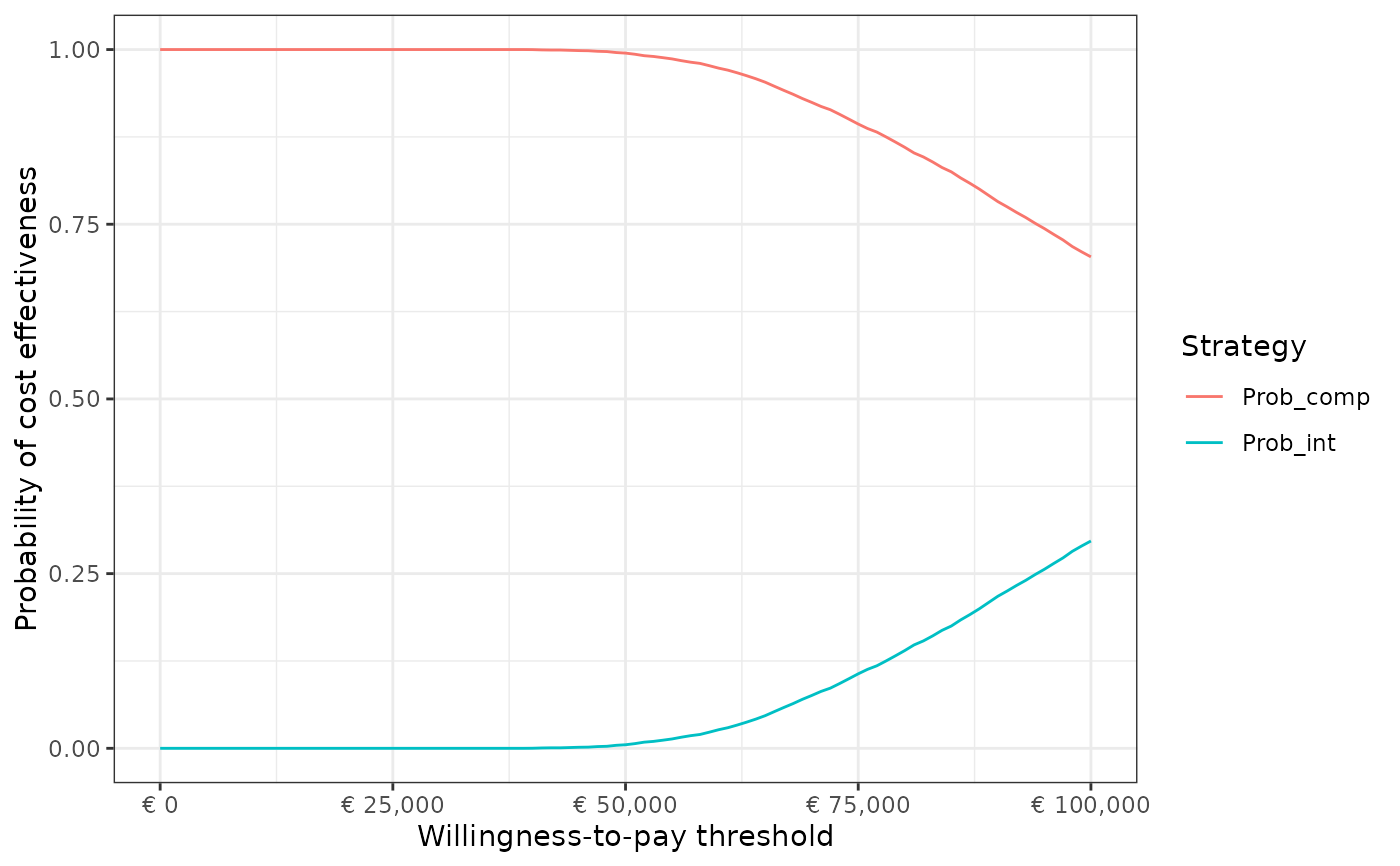
Plotting the cost-effectiveness acceptability curves.
Source:R/fct_costeffectiveness.R
plot_ceac.RdThis function plots cost-effectiveness acceptability curves.
Arguments
- df
a dataframe obtained through the `calculate_ceac()` or `calculate_ceac_mult()`.
- name_wtp
character. Name of variable of the dataframe containing the willingness-to-pay thresholds at which the probability of cost effectiveness have been defined.
- currency
character. Default is "euro". Determines the currency sign to use in the incremental cost effectiveness plane. Currently included signs: "euro", "dollar", "yen", "none".
Examples
# Plot CEAC based on results from calculate_ceac()
data("df_pa")
df_ceac_p <- calculate_ceac(df = df_pa,
                            e_int = "t_qaly_d_int",
                            e_comp = "t_qaly_d_comp",
                            c_int = "t_costs_d_int",
                            c_comp = "t_costs_d_comp")
plot_ceac(df = df_ceac_p,
          name_wtp = "WTP_threshold",
          currency = "none")